Updated: January 07, 2026
Applicable Role: Company Managers
Prerequisites:
- WAVE Interactive account
- Access to Interactive Analytic Dashboard (If you believe you should have the permission, please reach out to support HERE)
Step-by-step guide:
1. To view your Registration Report you will need to first be on your main Dashboard. You will see an icon at the top to switch the Dashboards.

2. You should see multiple dashboard types, at the bottom you will see the "Interactive Dashboard", click on the "Interactive Dashboard".

3. On the bottom right you will see the "Registration Report" tool, this tool shows the top registered courses for your company, with the ability to select whatever date range you would like to see.

4. To add a date range you can use the "Date Range" option below the graph. Once the date range is set just click "Filter" to view the results.
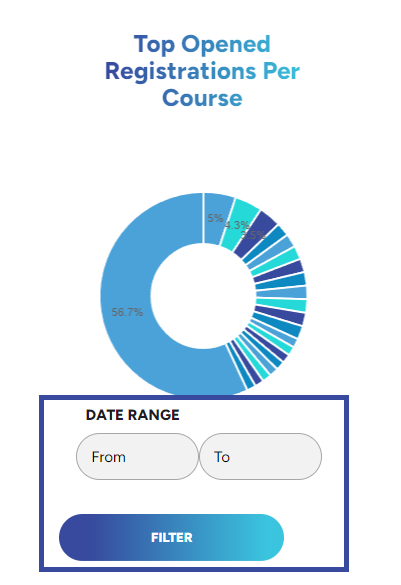
5. If you would like to see more details, you can click on the graph itself to bring up a pop-up window that provides a more detailed breakdown of your company's registrations

"If you need further assistance after reading this article, please submit a ticket HERE and someone from our team will assist you soon!"